Cookie settings

We use several types of cookies on this website to provide you with an optimal online experience, to increase the user-friendliness of our portal and to constantly improve our communication with you. You can decide which categories you want to allow and which you do not want to allow (see "Custom settings" for more information).
Name Usage Duration
privacylayerStatus Agreement Cookie hint1 year
Name Usage Duration
_gaGoogle Analytics2 years
_gidGoogle Analytics1 day
_gatGoogle Analytics1 minute
_galiGoogle Analytics30 seconds

Q-QUIZ May 2018

SPC is a central tool in industrial quality assurance, but what is behind it?

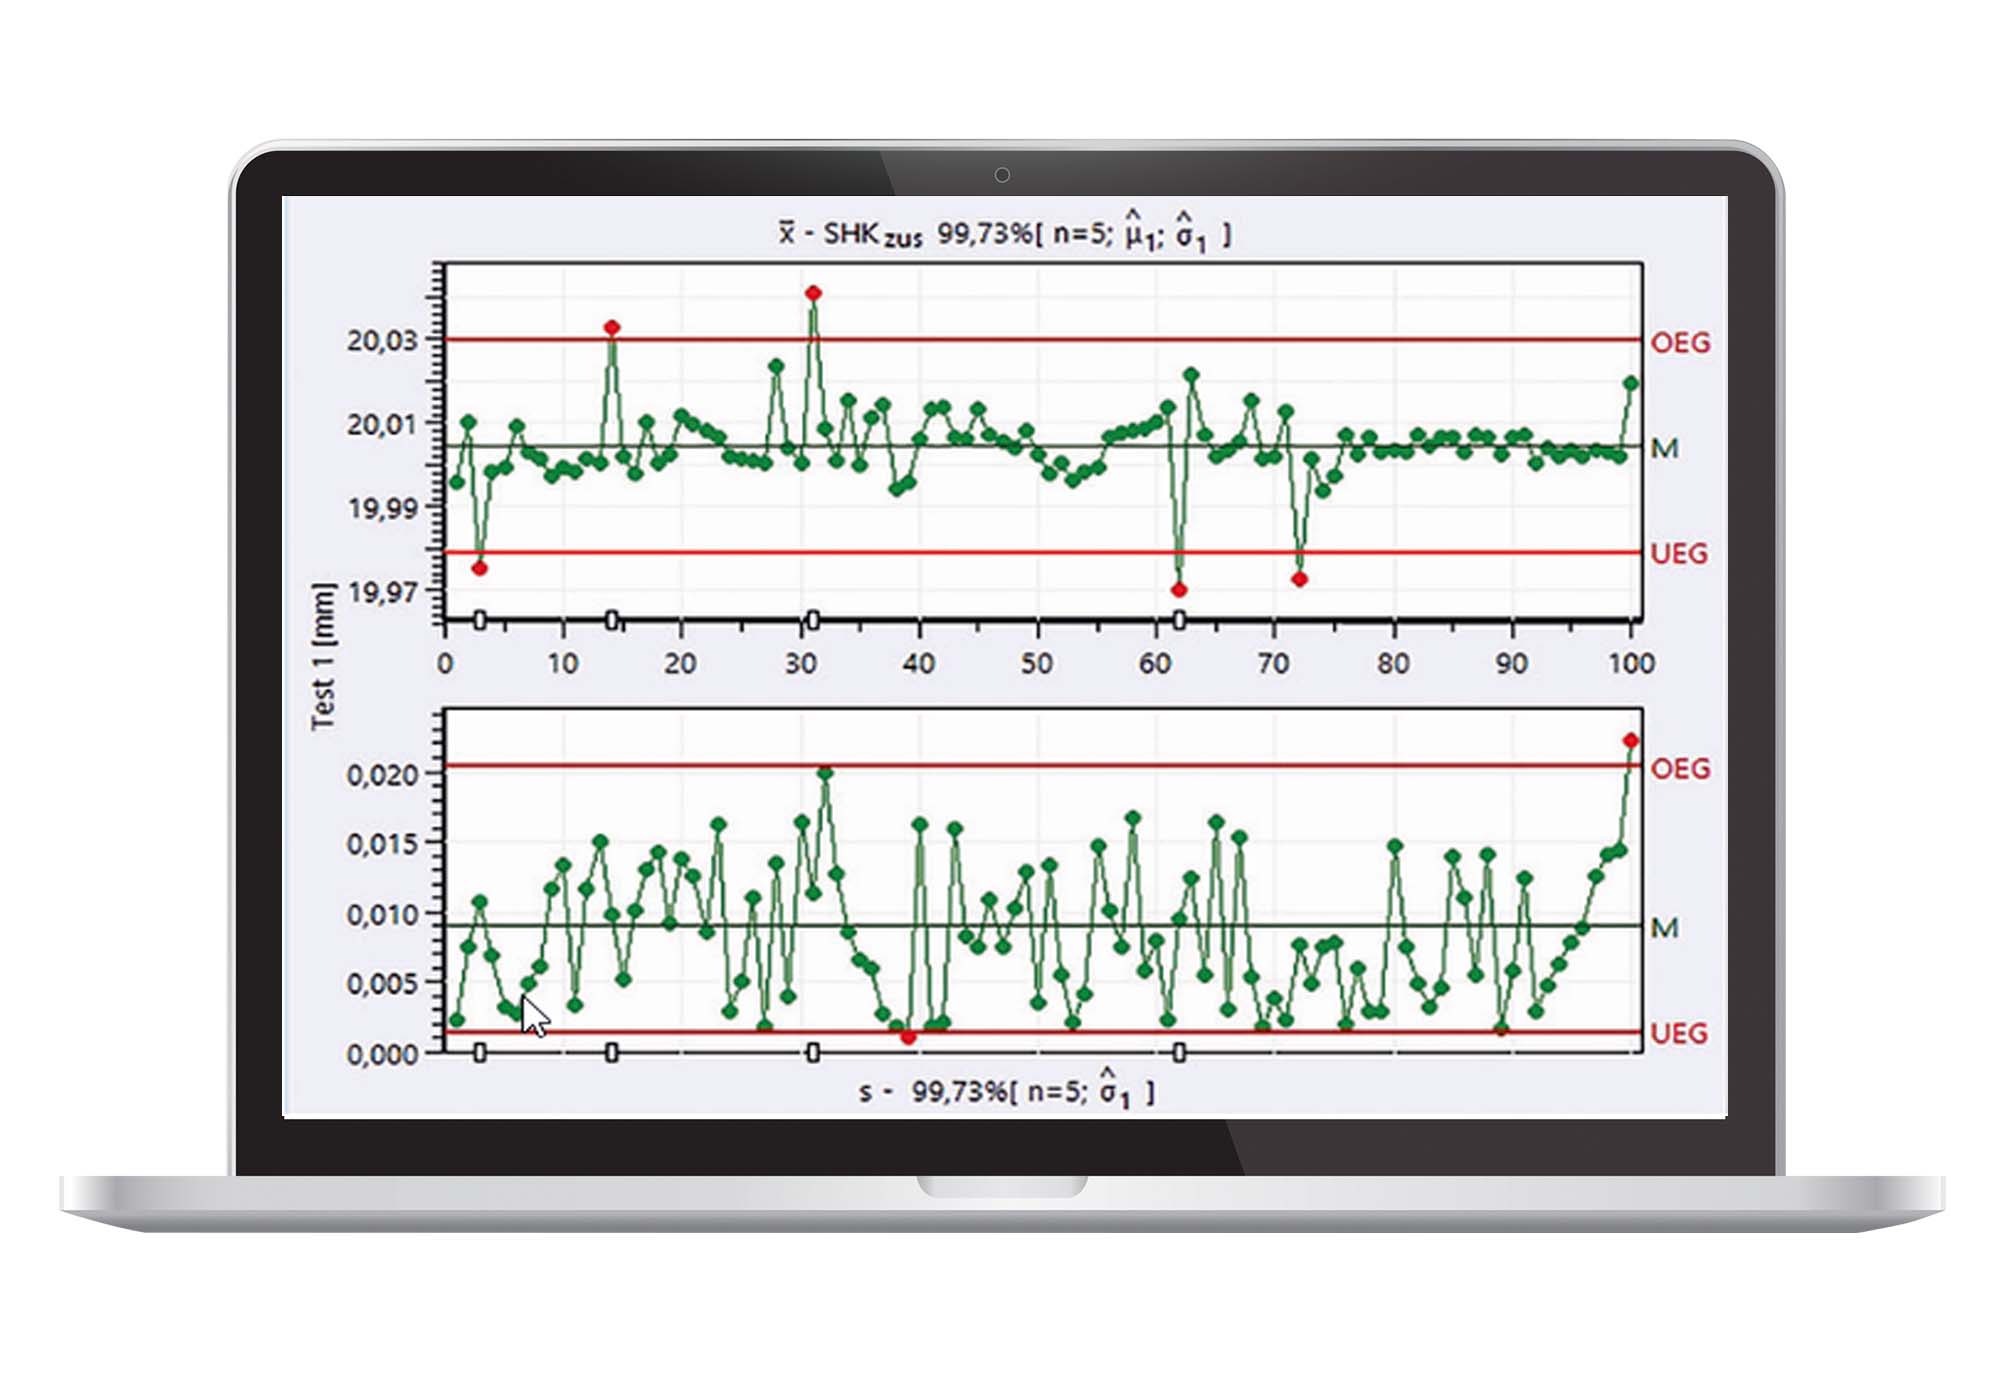
Statistical process control (SPC) proves that production processes meet the respective requirements. Since these processes manufacture products, you specify characteristics for each product and measure them. The documentation and even the final proof of capability are based on numerical and graphical results and frequently illustrated in quality control charts.

National and international standardisation, however, agreed on a definition describing SPC in terms of process control but involving the aspect of process improvement, too. Statistics of machine performance studies, measurement system and process capability analysis play an important role. Are you acquainted with this subject?


1. How do the statistics of machine performance relate to the ones of process capability?

  • Cpk is by 0.33 less than Cp which is by 0.33 less than Cmk which is by 0.33 less than Cm.
  • Cm is greater than Cpk in most cases.
  • Cmk and Cp are frequently equal.


2. How do measurement system capability and machine performance relate to each other?

  • The deviation of the determined Cm/Cmk value from the actual Cm/Cmk value is calculated from the MPE specified for the measuring instrument.
  • The greater Cg, the more approaches the actual Cm/Cmk value the determined value.
  • Cg does not affect the difference between the determined and the actual Cm/Cmk value.


3. You calculated a Shewhart average chart based on a sample size of n = 5 . The process is normally distributed and stable. The specified control limits for the location amount to ± 3?. Which statement is correct?

  • Not a single measured value may exceed specification limits.
  • Not a single subgroup average may exceed control limits.
  • An average of 300 subgroup averages will exceed the control limits.


4. Find the piece of equipment that should reasonably not be subject of a machine performance study.

  • Coordinate measuring machine
  • Multi-spindle turning machine
  • Bottle filling system


Our Q-QUIZ is published once a month. You can find the answer to all questions of the current quiz in the PDF file below.

This quiz was originally published in the April issue 2017 of the German magazine QZ Qualität und Zuverlässigkeit (http://www.qz-online.de/).


Similar articles