EXPANDED MEASUREMENT UNCERTAINTY IN 100% INSPECTIONS
2019-06-19 - How to apply the second edition of VDA Volume 5 in practice
| Name | Usage | Duration |
|---|---|---|
| privacylayer | Status Agreement Cookie hint | 1 year |
| Name | Usage | Duration |
|---|---|---|
| _ga | Google Analytics | 2 years |
| _gid | Google Analytics | 1 day |
| _gat | Google Analytics | 1 minute |
| _gali | Google Analytics | 30 seconds |

23 October 2017: Wolfgang Schultz
While discussing the issue of process capability, we always have to face the three terms given in the title of this article. However, isn’t it all the same or are there really some differences?
Our first article “Process capability – a simple illustration“ published in April 2016 explains the basic principles of process capability analysis. This new technical contribution ties in with the first article and focuses on the terms mentioned above. Our previous article about process capability talked about the normal distribution model and illustrated how to calculate capability indices based on this type of distribution. We also touched the topic of a series of processes whose output actually approaches the “bell curve” quite well in reality, at least in a short observation period. This information lends some empirical insight into many typical production processes – turning, milling, drilling, trimming, grinding and many more.
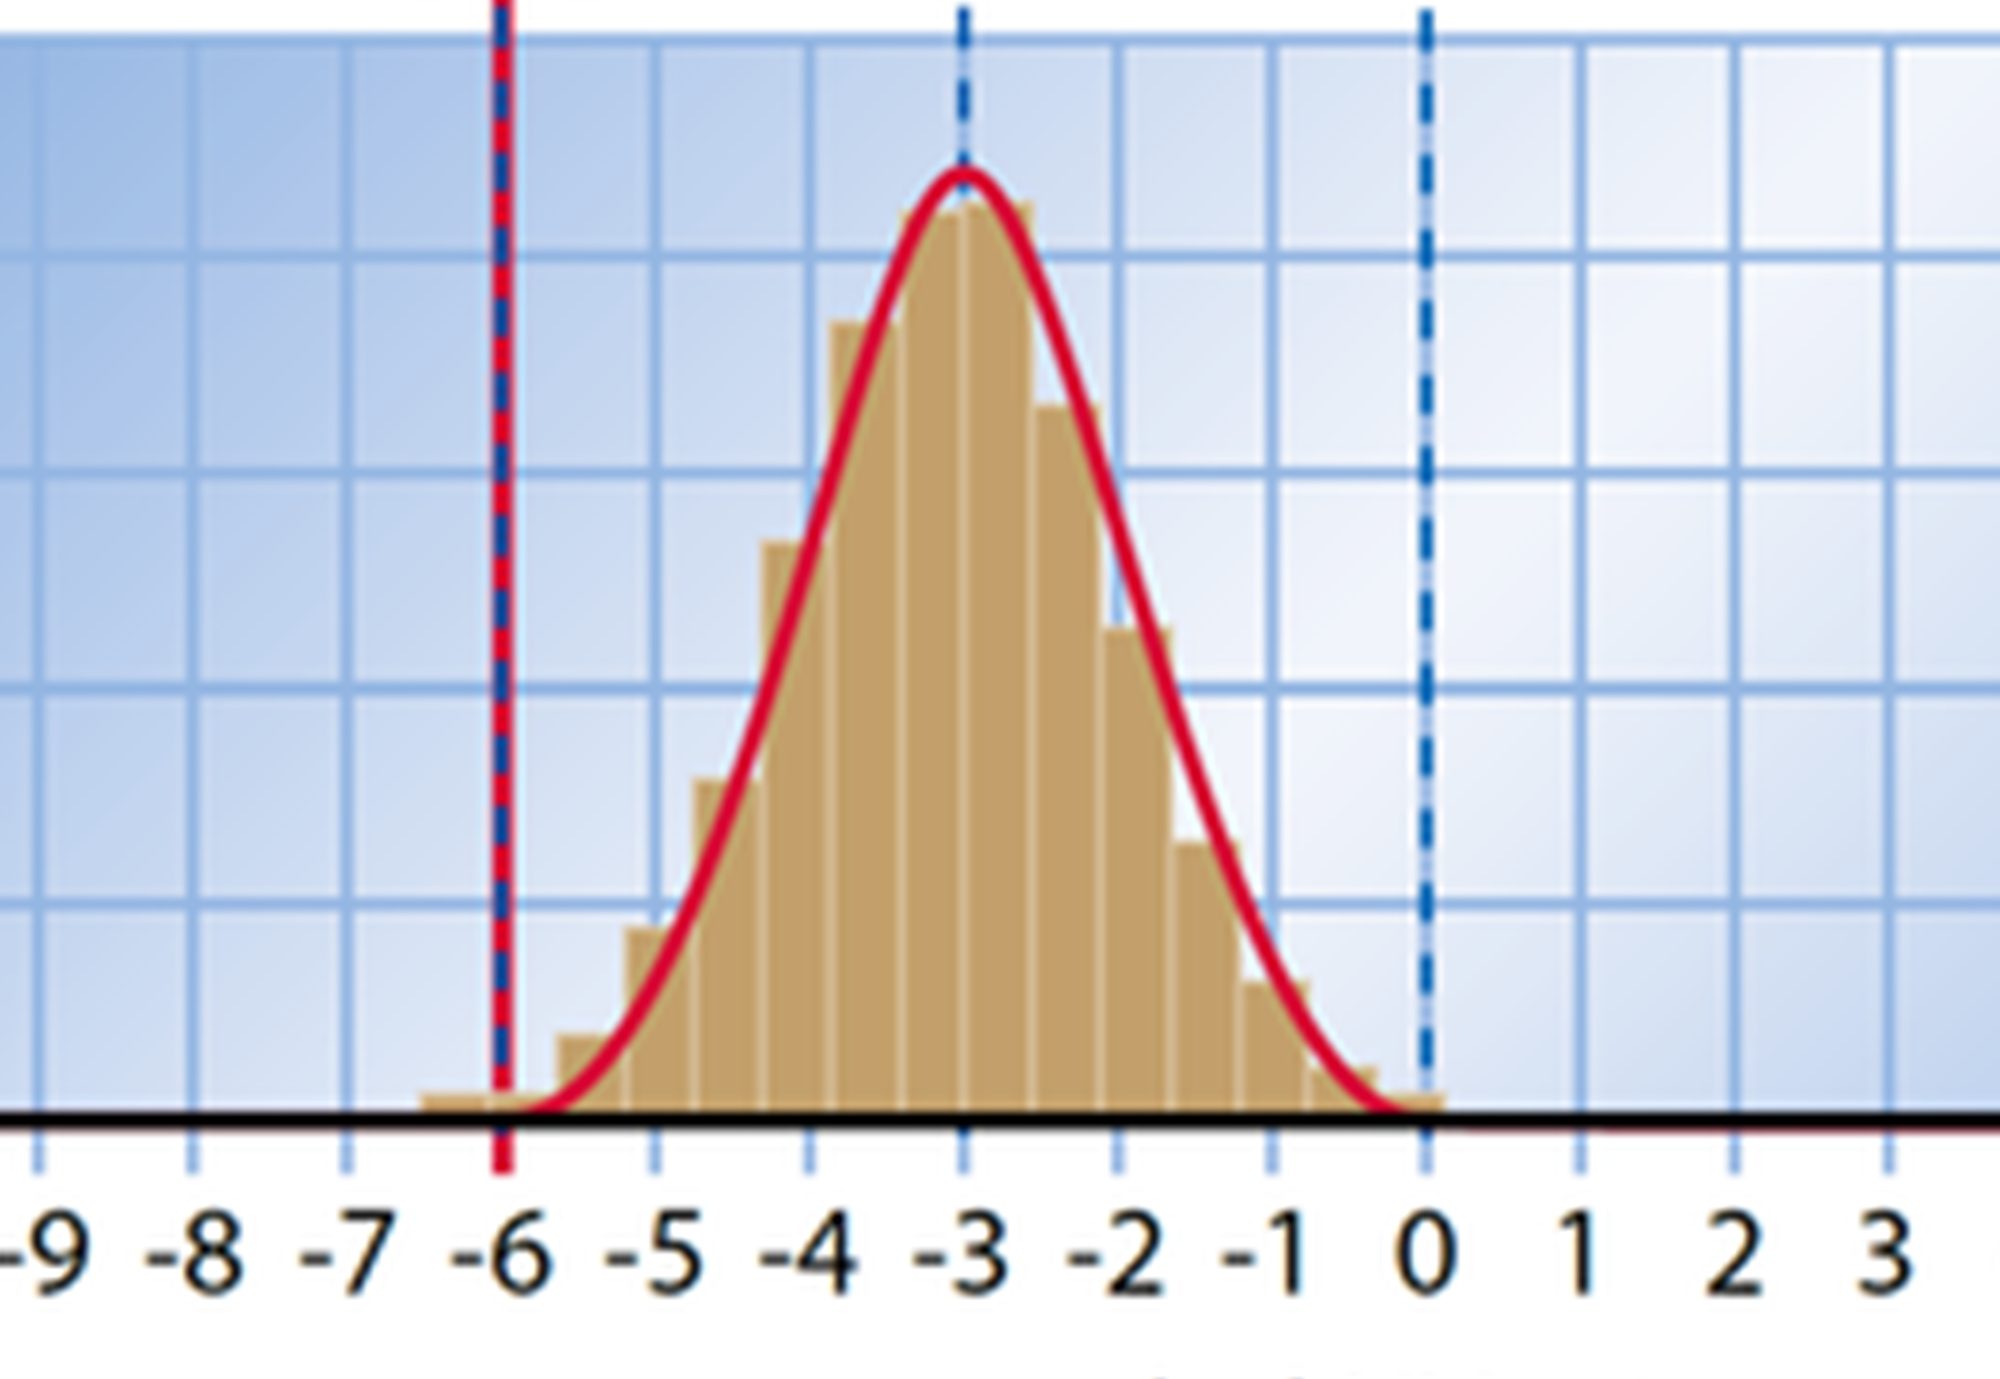
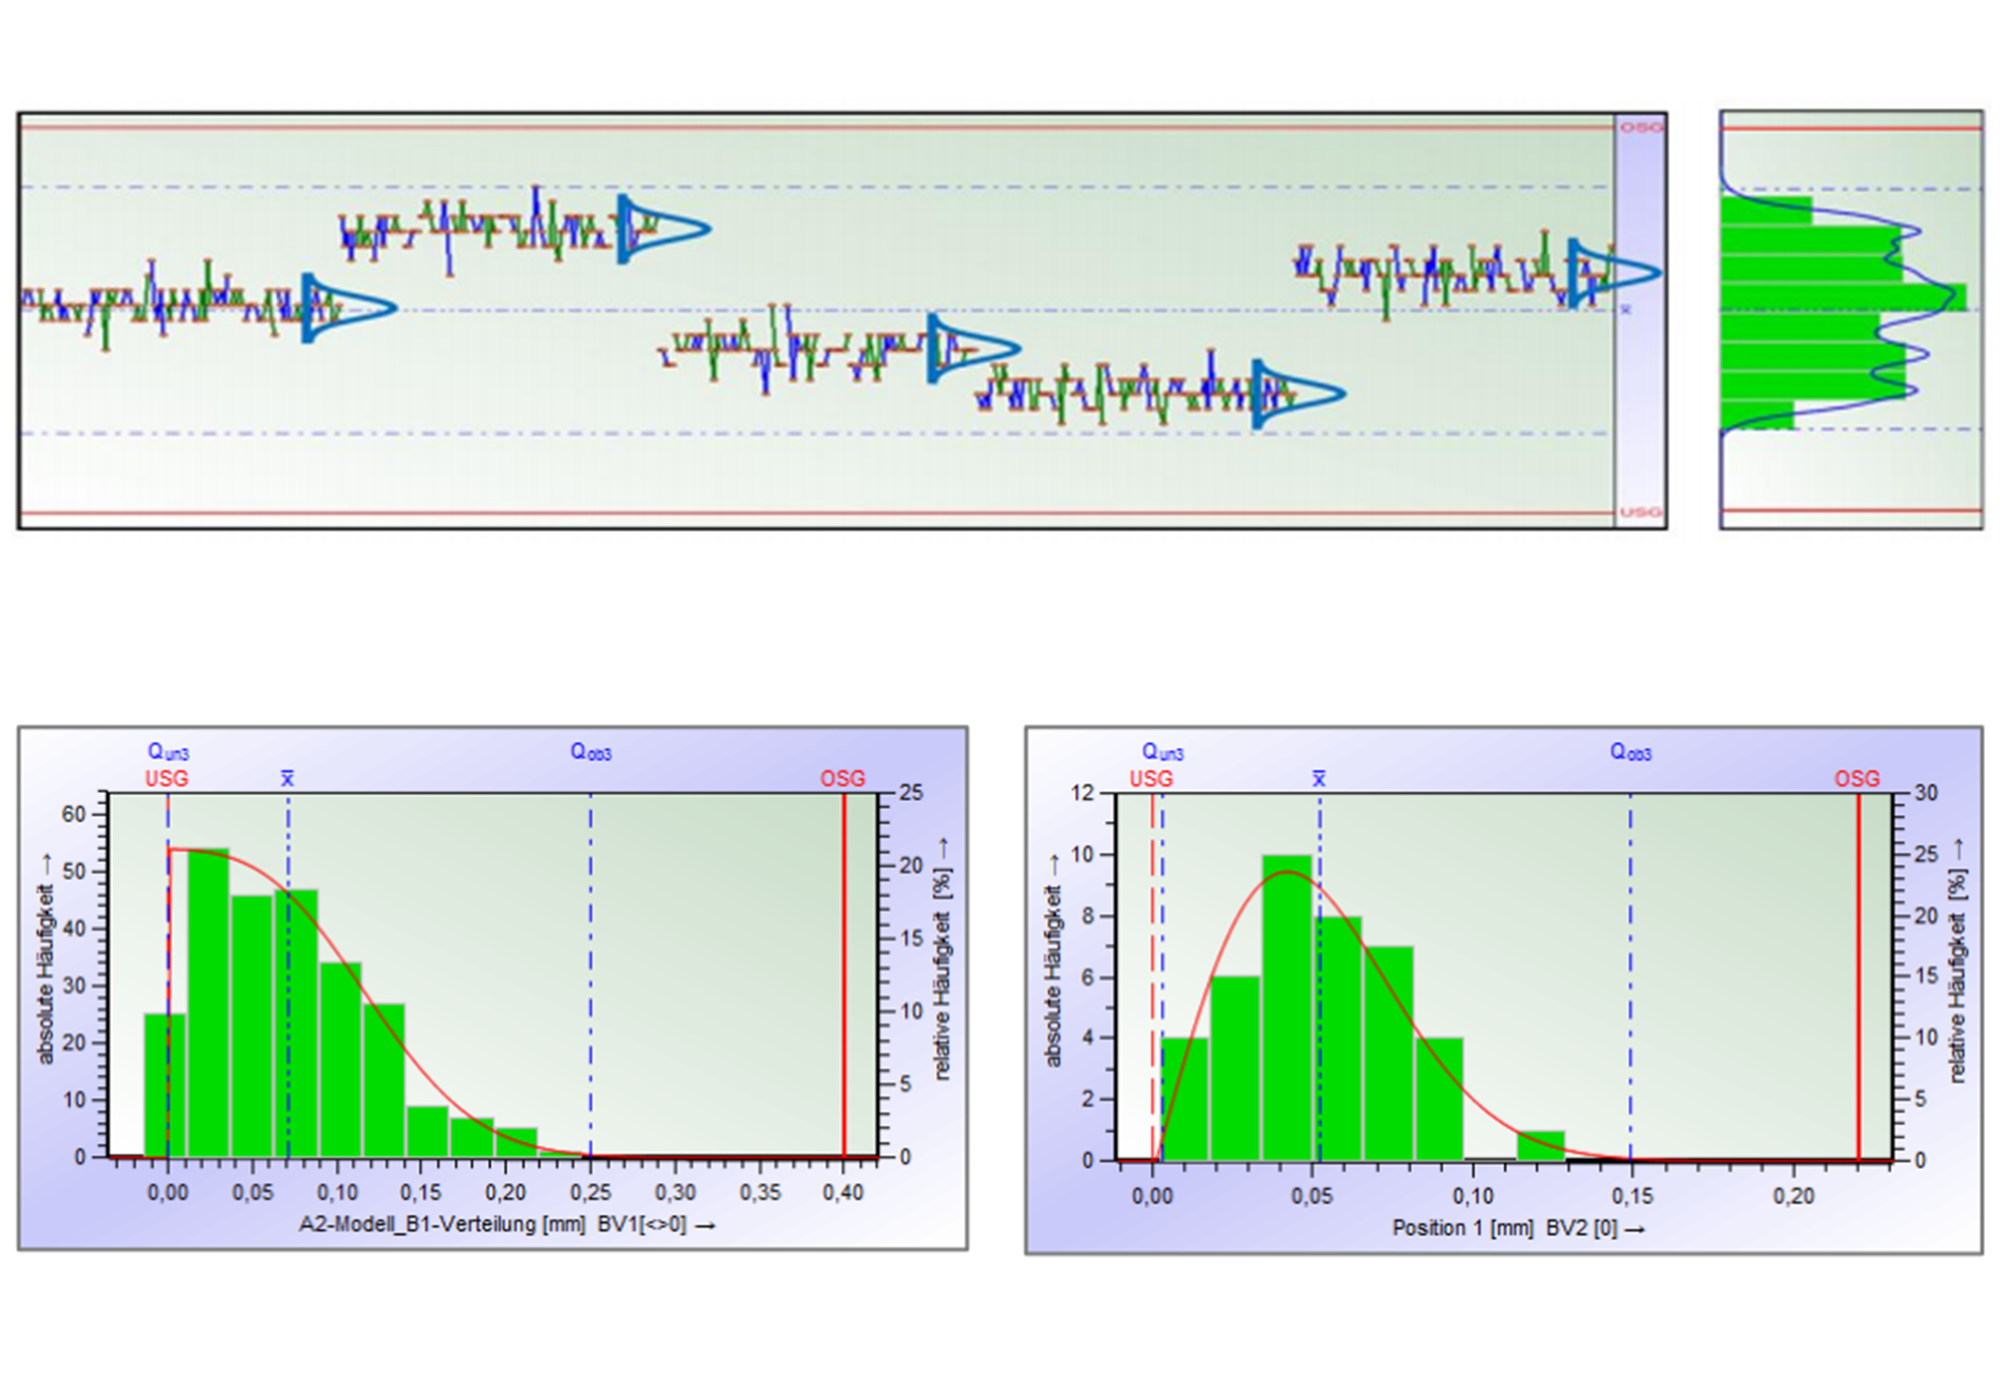
However, we also mentioned that normal distribution does not apply to processes analysed over a longer period because they will show smaller or larger deviations in most cases. Almost every real process is subject to various influences outweighing the random variations illustrated in the previous article. Just think about temperature fluctuations between day and night or summer and winter, different batches of material, tool wear or even operator influences. There might be a random and/or systematic change of distribution parameters. The total variation of all values, however, will increase at any rate. The distribution of all individuals might have a different shape, e.g. flat, steep, skew, multimodal but even normally distributed. The graphic below gives an example of one of the numerous possible versions...