Statistical process control implies an effective combination of theory and practice. The theory mainly involves quality control charts that are based on statistical principles and detect systematic process deviations.
Quality control charts separate these kinds of deviations from the “normal” process behaviour.In practice, quality control charts provide the probability of required corrective actions and visualise the success of such action. This is due to properly selected subgroup sizes, subgroup frequencies and statistical basics.
Eventually, quality control charts make us reflect effects and relationships within a process. We apply the knowledge we gain to control our processes.
Are you familiar with the matter?
1. What are the minimum requirements you must meet to control the process location of a characteristic based on a quality control chart?
- The characteristic has to be quality-assured and stable.
- The characteristic does not have to be quality-assured but stable.
- The characteristic has to be quality-assured but not necessarily stable.
2. Quality control charts typically show whether an onserved characteristic could be controlled effectively after a process is released for series production. Do you know another typical application?
- The quality control chart identifies the process model in preliminary process analysis. This model helps you select and calculate the final control chart used in long-term analysis.
- The control charts applied in preliminary process analyses are able to determine that the tolerance of the observed characteristic is too small.
- If a customer demands a 100% inspection, the quality control chart calculates a specific subgroup size. By applying this subgroup size, you may do without a 100% inspection.
3. VDA applies an error probaility of alpha = 1% to calculate a quality control chart whereas AIAG defines ? = 0.27%. How do these different error probabilities affect control charts?
- Different error probabilities have not got any impact on how control charts respond to process variations.
- A higher error probability is more likely to detect process variations.
- A low error probability already detects slight changes of process location.
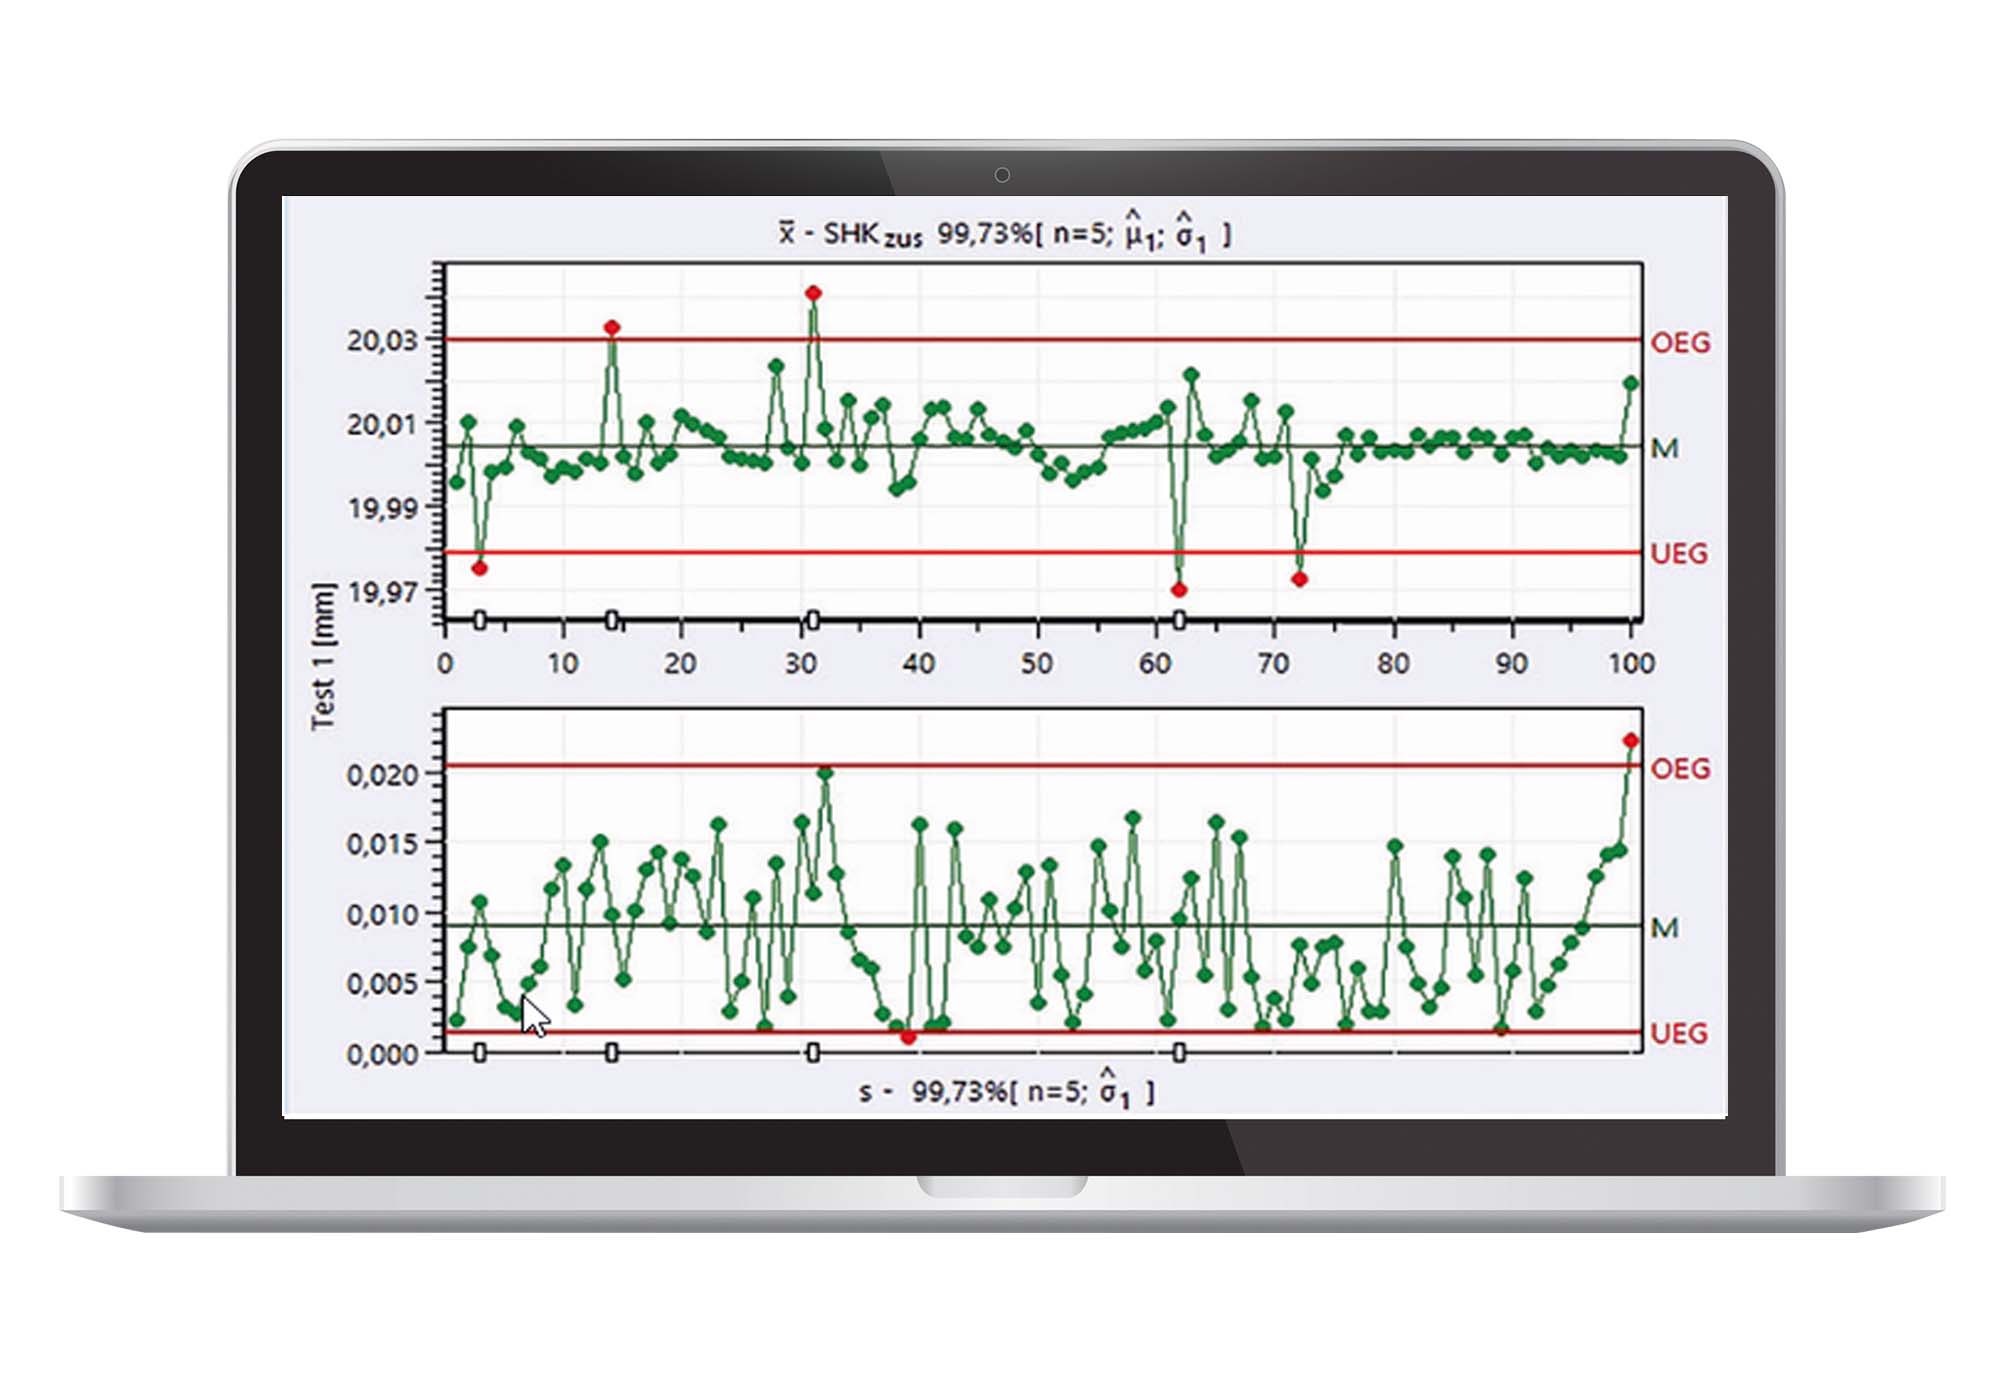
4. Why do we apply two-track quality control charts to control continuous characteristics?
- Since they show the characteristics and the time intervals between values exceeding control limits. This information helps you prove stability.
- Since the location and variation of a characteristic might change independently, it is reasonable to track both separately.
- For historical reasons: In the past, quality managers always wanted to reduce the number of control charts and thus showed two quality characteristics of a product or process in the same chart.
Our Q-QUIZ is published once a month. You can find the answer to all questions of the current quiz in the PDF below.
This quiz was originally published in the December issue 2016 of the German magazine QZ Qualität und Zuverlässigkeit (http://www.qz-online.de/).