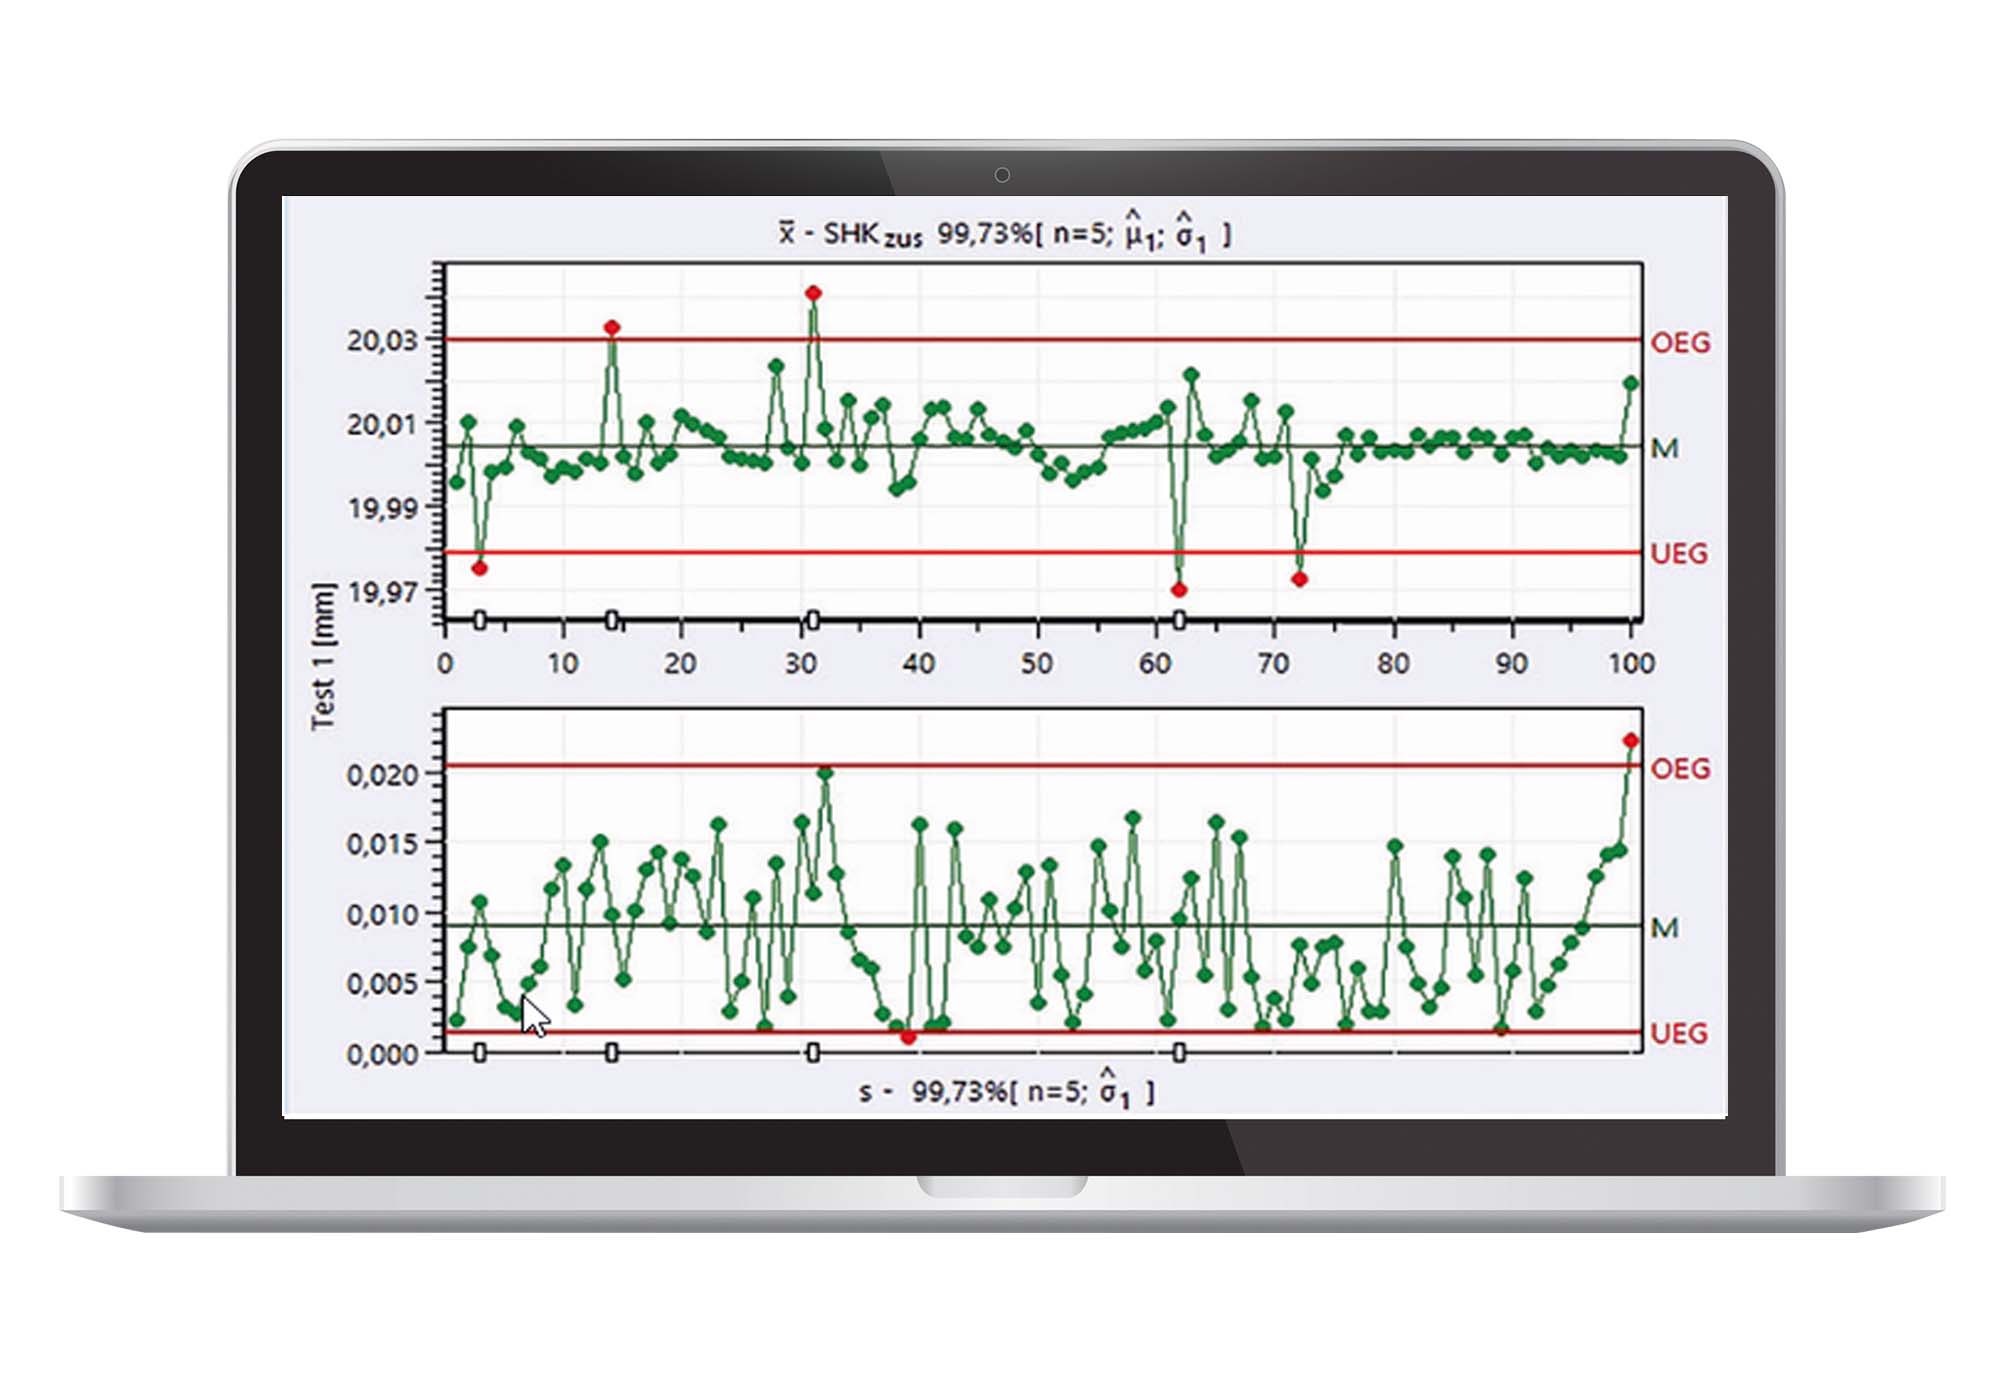
The success of capability analyses often depends on how sensitive quality control charts are. As an example, you conduct a process capability analysis for a groove depth of 10.2 ± 0.06. The result is a normally distributed process where Cp = 1.69 and Cpk = 1.43. Use this information to calculate a Shewhart control chart for median and standard deviation. The sample size amounts to 5 and the control limits are based on a random variation range of 99.73%.
1. After you changed a tool, you set the machine to the tolerance centre again. The next five subgroup averages are above the tolerance centre. What is your conclusion?
- This might be a coincidence – I will keep an eye on it.
- The measuring instrument is maladjusted.
- I must change the tool again.
2. After a sudden bearing damage in the engine of the milling cutter, the variation increases by a factor of 1.5. The increase shows that…
- … the next subgroup exceeds the control limit of the track monitoring the variation.
- … the next subgroup contains at least one value exceeding the specification.
- … one of the next 10 averages is likely to exceed the control limits.
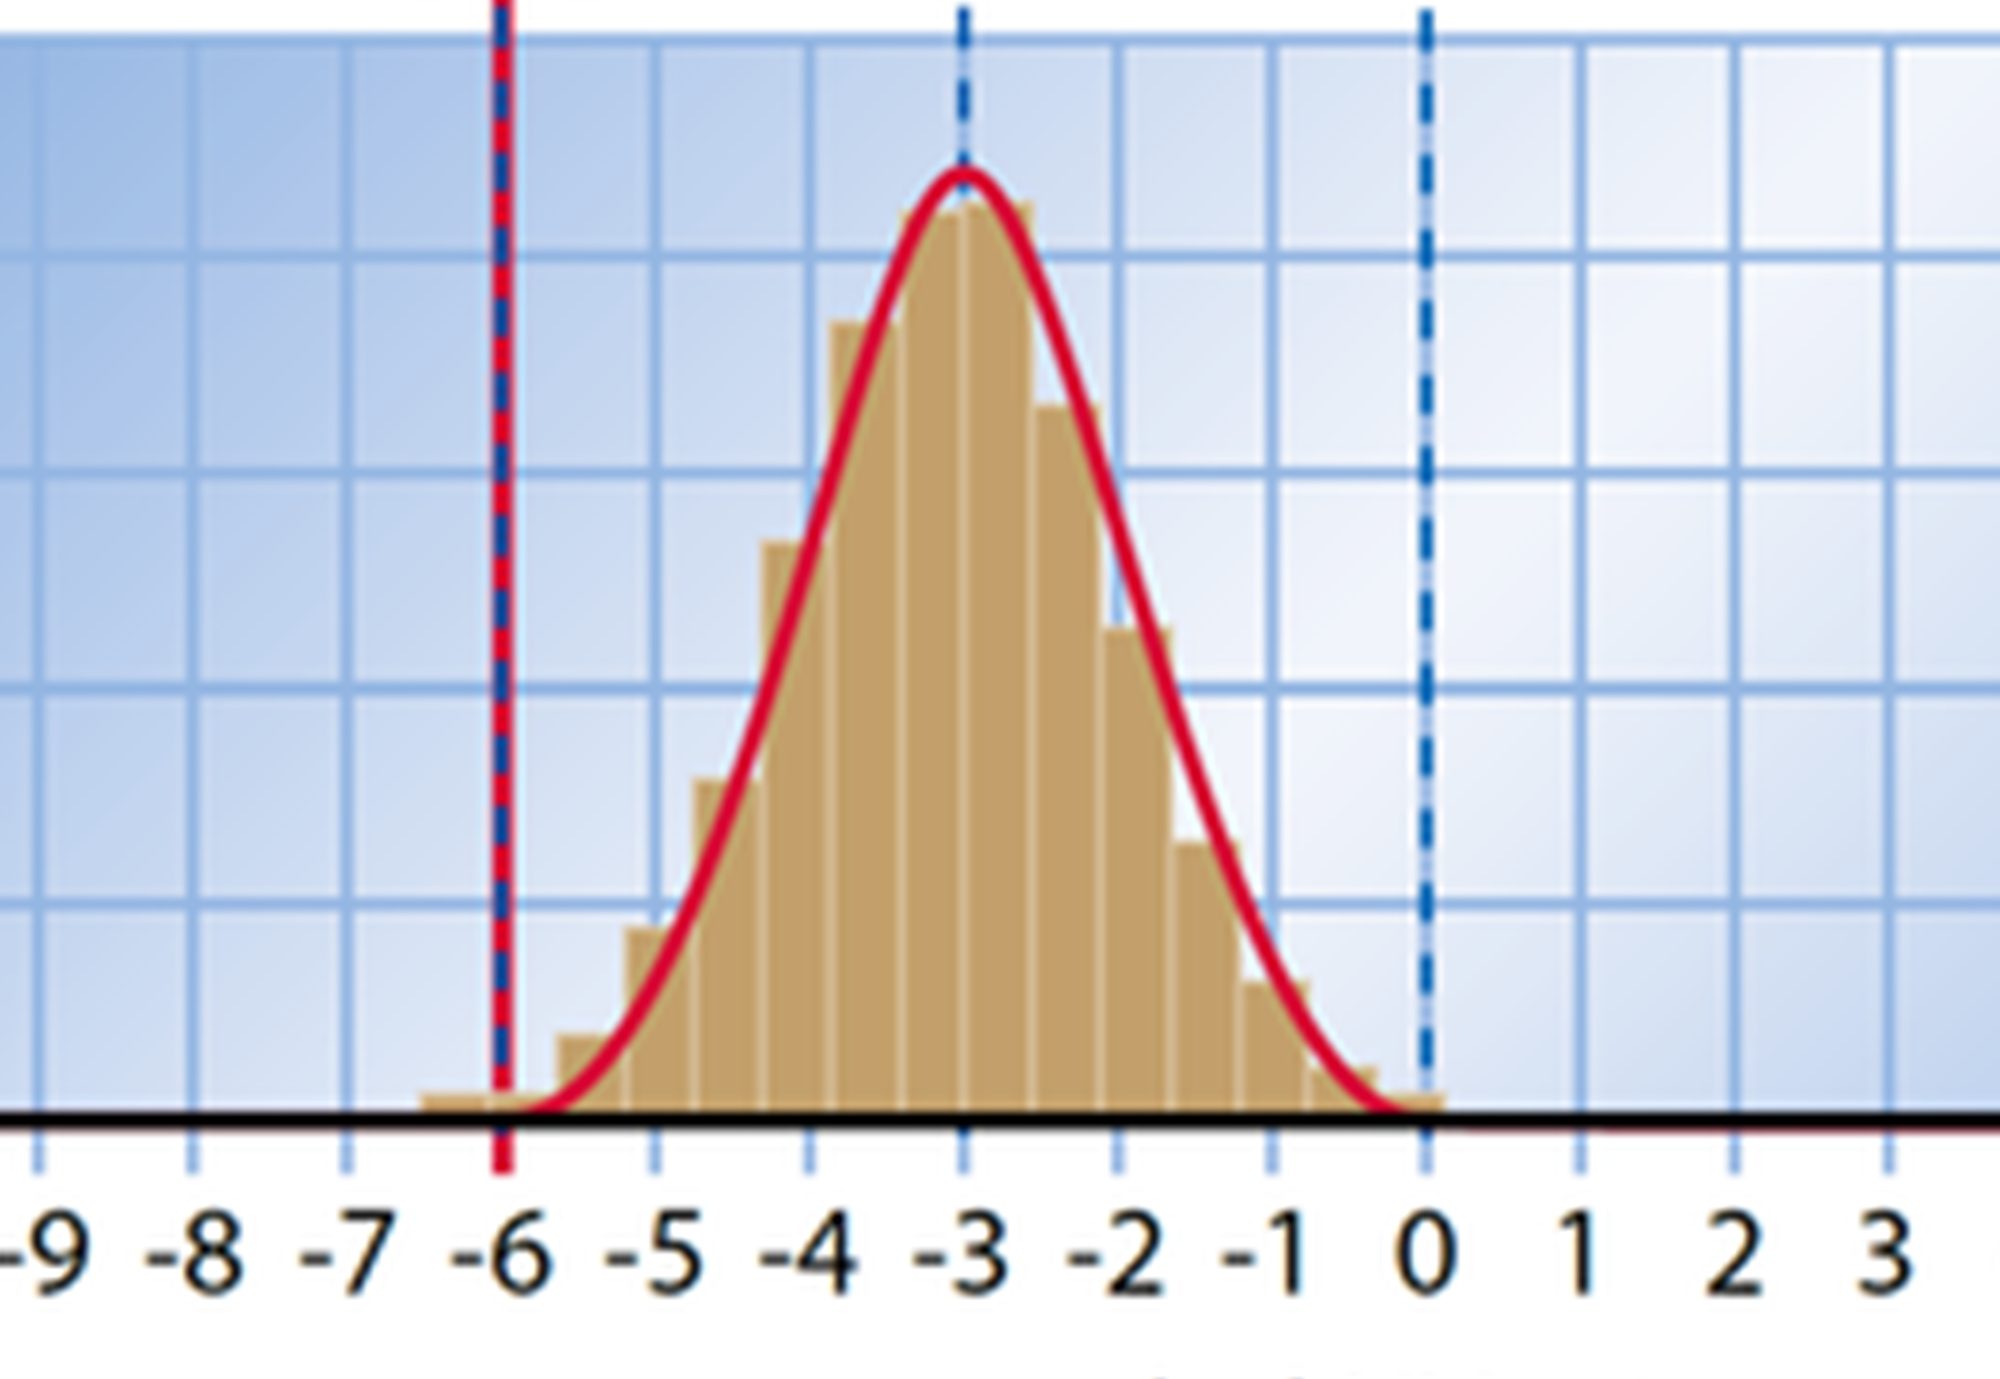
3. After you repaired the bearing, you start a machine performance study leading to Cm = 2. You set the machine to the tolerance centre again, reduce the amount of inspection and inspect only one out of 50 parts. How obvious will malfunctions become now?
- It is hard to detect that the standard deviations doubles, even though this is likely to lead to rejects of about 3000 ppm.
- It is hard to detect that the location changes by 3/100; however, this change leads to a proportion of rejects amounting to less than 0.1%.
- You will not detect that the location changes by 6/100, even though this leads to a proportion of rejects amounting to about 50%.
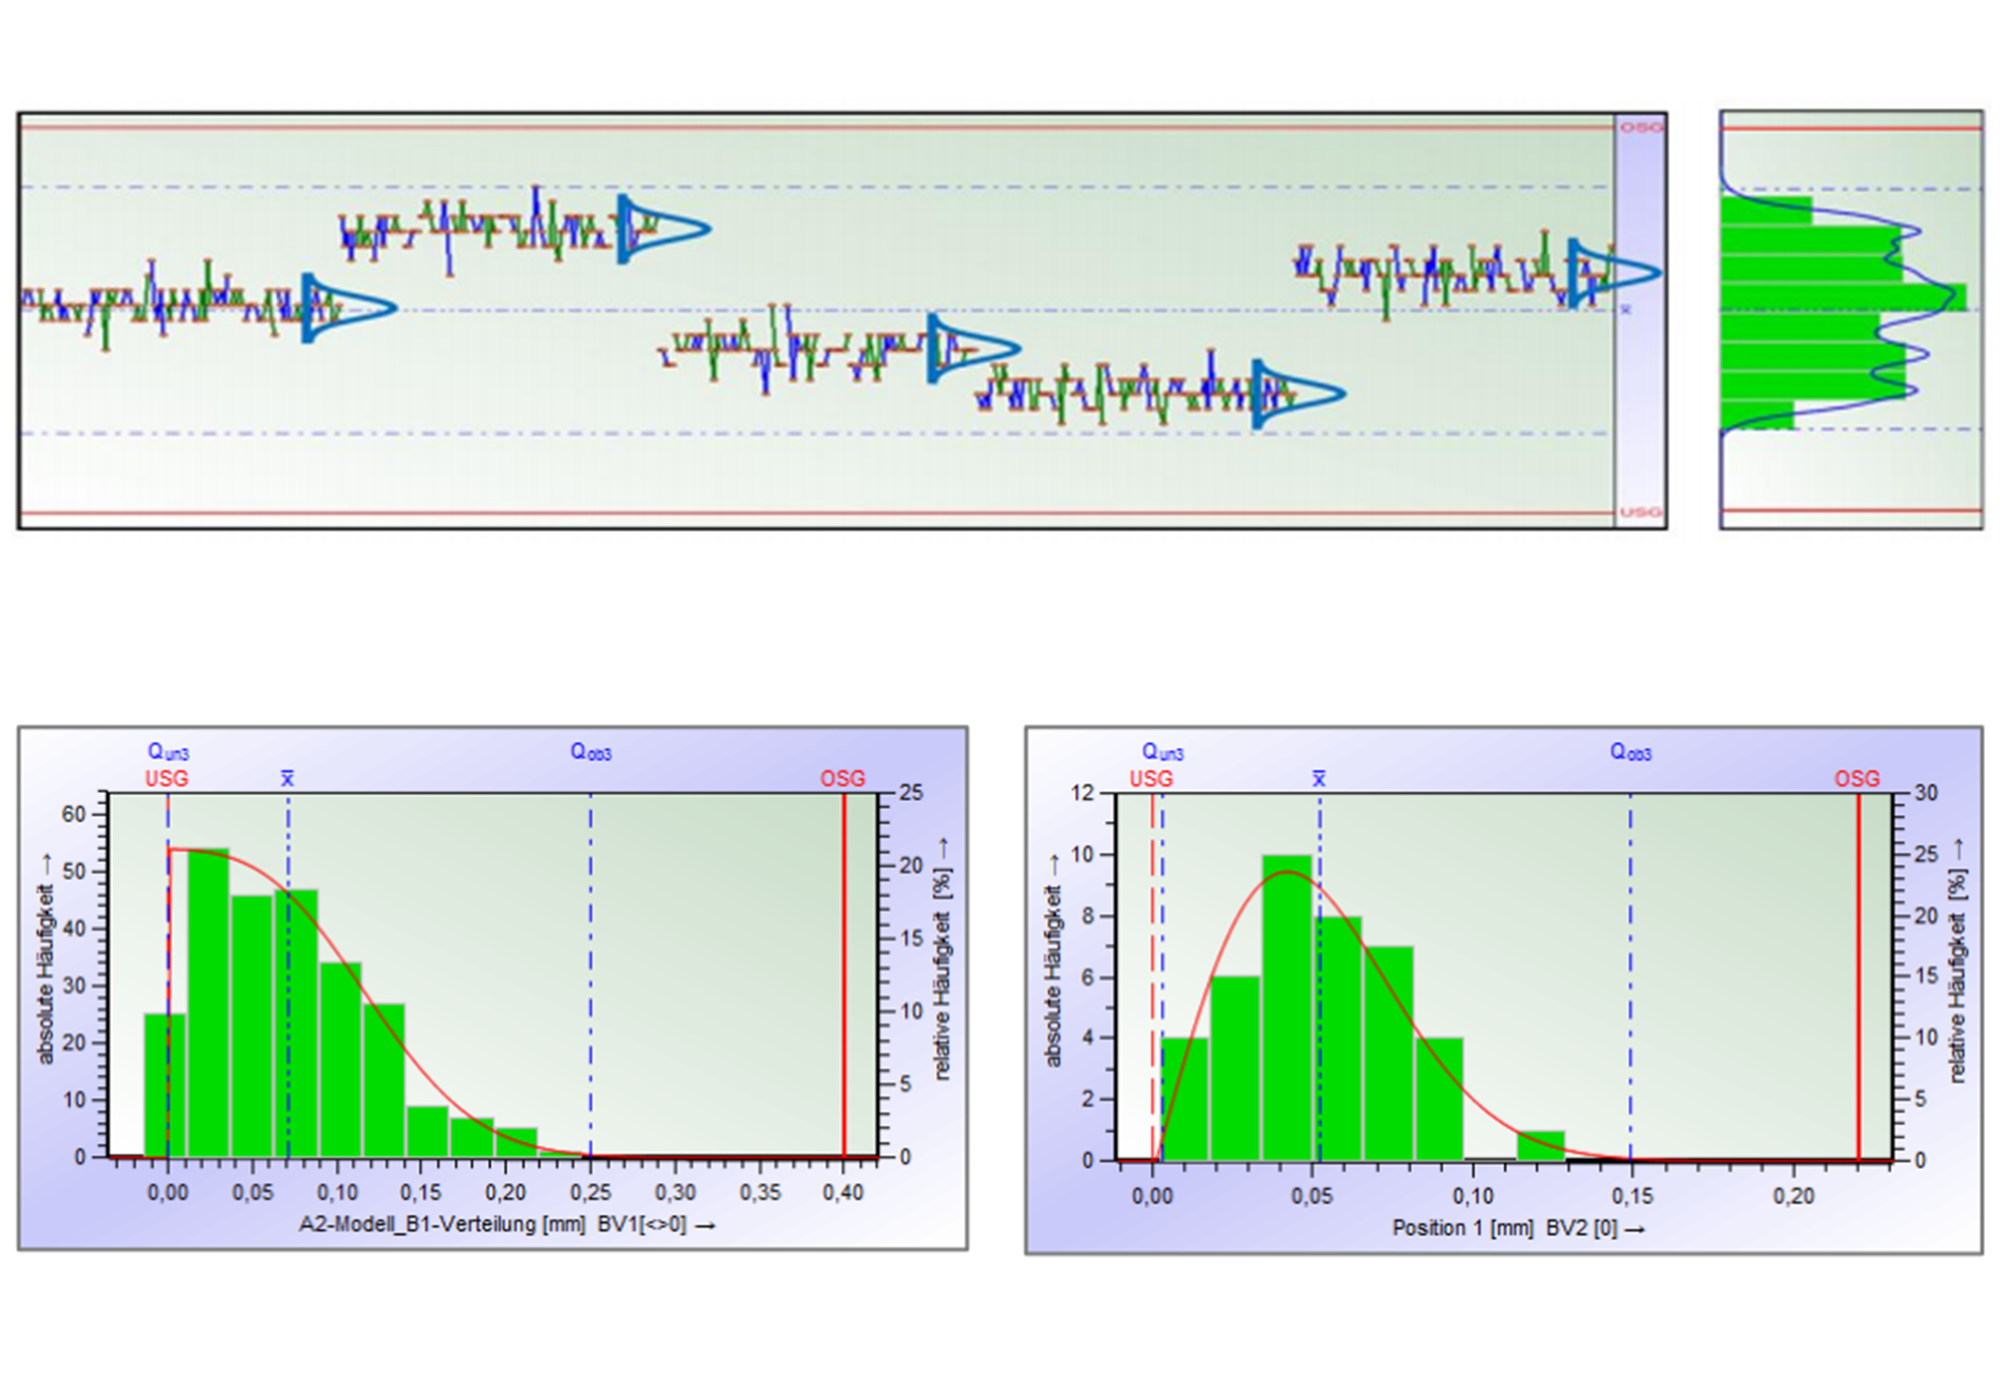
4. You use a plastics injection moulding procedure to produce a distributor whose unit weight indicates a zero-defect production. The unit weight, however, varies between the synthetic granules’ different batches of material. The variation remains constant. How can you control the process?
- You recalculate the machine performance Cm and Cmk and the control chart for each material batch.
- You use a Shewhart control chart with expanded control limits for monitoring the location. The control limits of the variation chart remain the same since they are more sensitive and better indicate a change in unit weight.
- You calculate the total variation from all values recorded so far and this define the 99.73% control limit for average and standard deviation.
Our Q-QUIZ is published once a month. You can find the answer to all questions of the current quiz in the PDF file below.
This quiz was originally published in the December issue 2017 of the German magazine QZ Qualität und Zuverlässigkeit (http://www.qz-online.de/).