THE SEVEN MOST FREQUENT ERRORS
2018-11-05 - ... in statistical process control
| Name | Usage | Duration |
|---|---|---|
| privacylayer | Status Agreement Cookie hint | 1 year |
| Name | Usage | Duration |
|---|---|---|
| _ga | Google Analytics | 2 years |
| _gid | Google Analytics | 1 day |
| _gat | Google Analytics | 1 minute |
| _gali | Google Analytics | 30 seconds |


17.10.2011: Frank Stockhaus
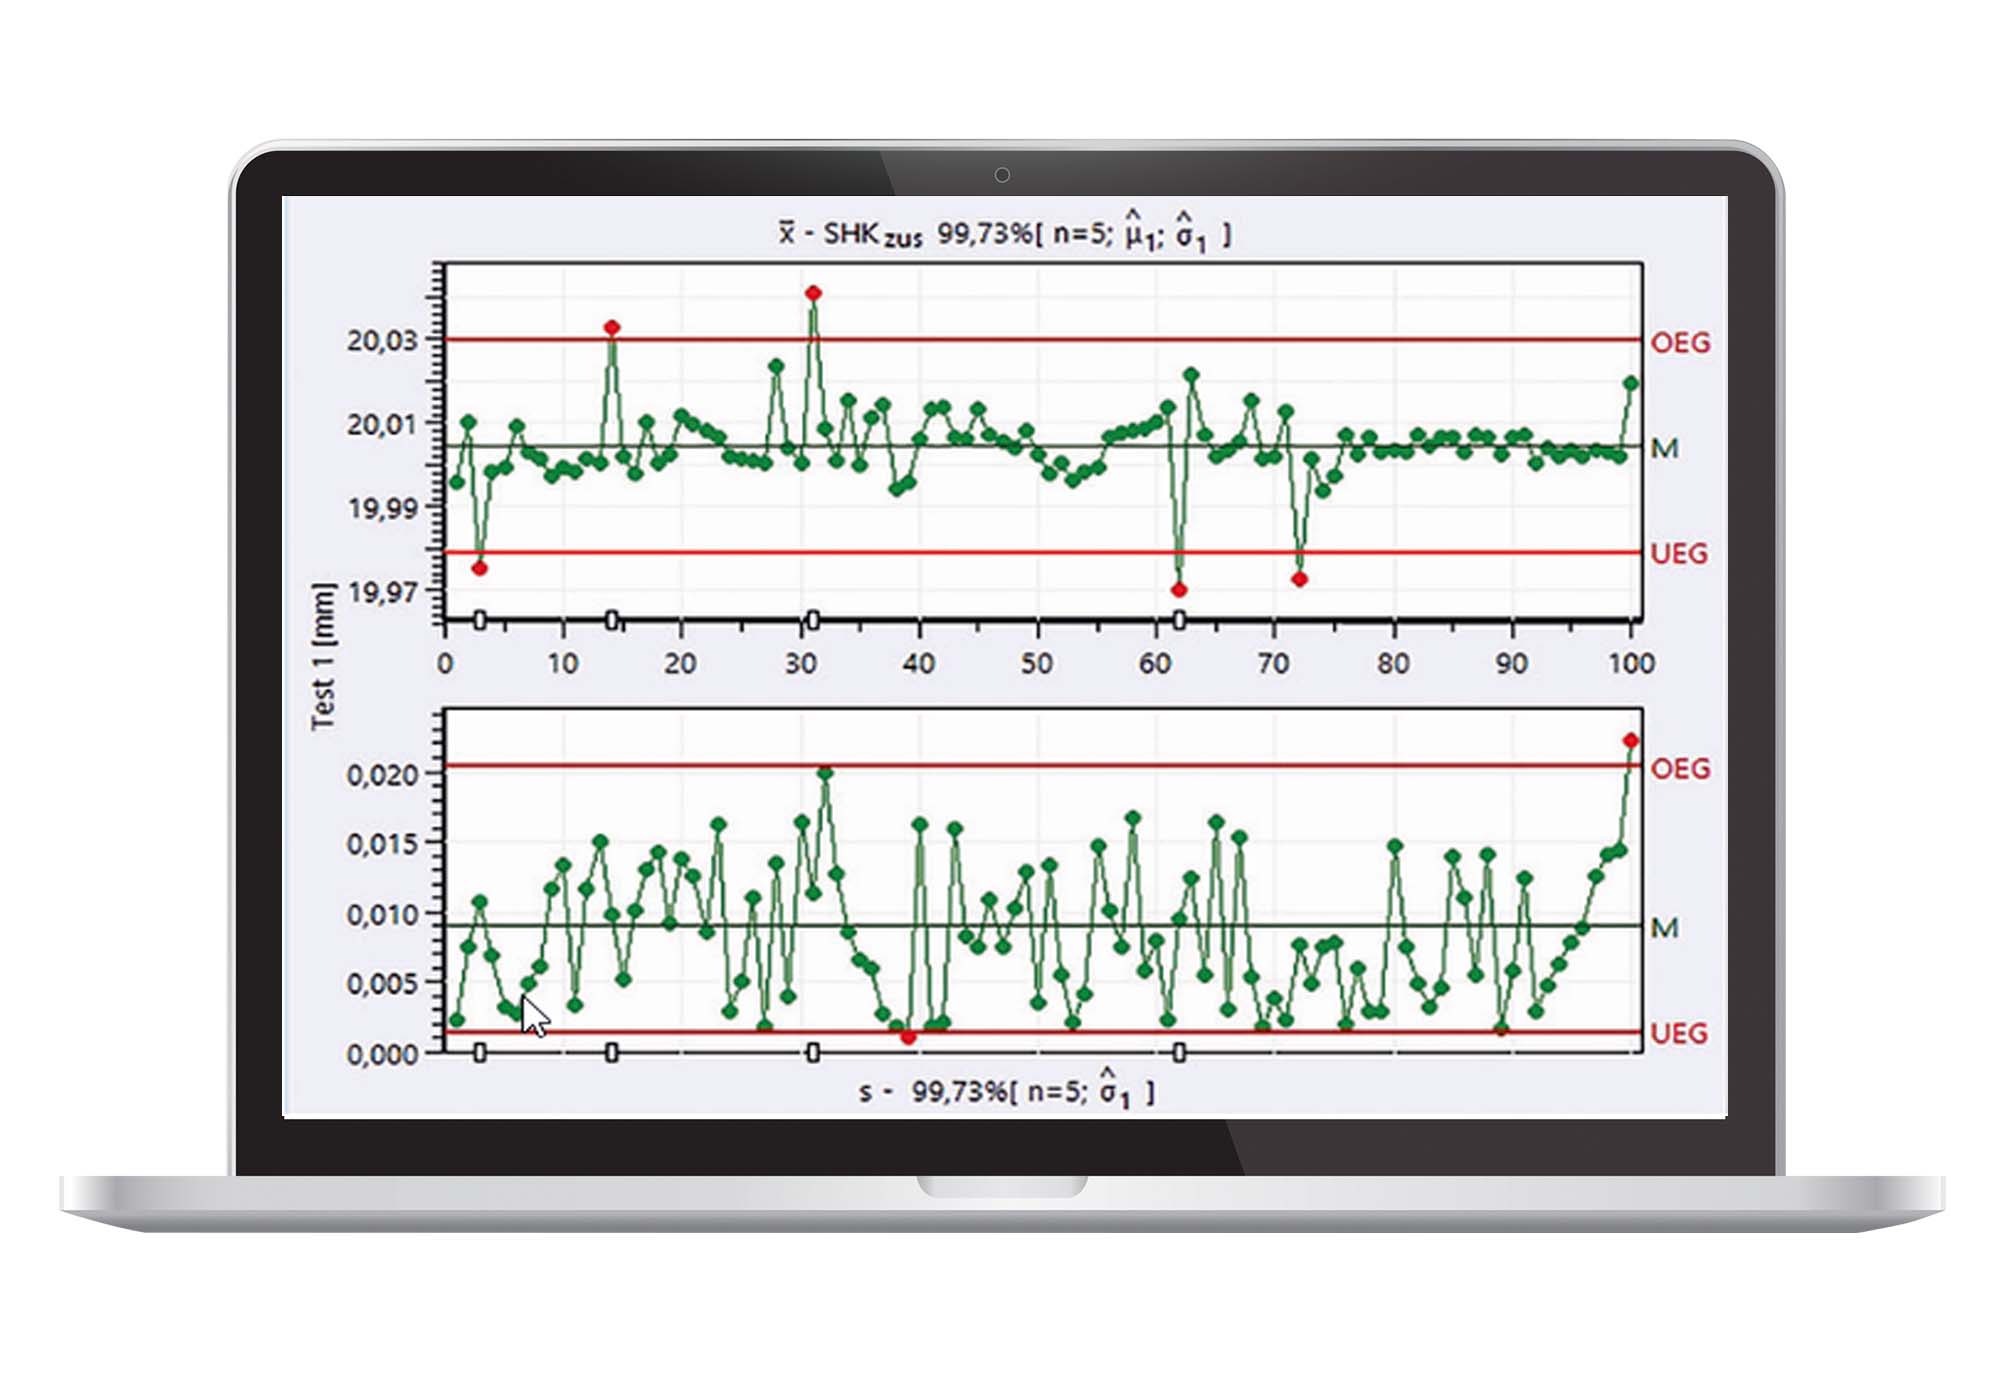
Companies maintain quality control charts a thousand times a day in statistical process control (SPC) and use the provided results to gain capable and stable processes. It is of particular importance to check the average location of the main product characteristics for nominal value and tolerance center. You usually use a Shewhart average chart for this task. Walter Andrew Shewhart was the first to introduce quality control charts in 1924 and published them in his book ”Economic Control of Quality of Manufactured Product“ in 1931.
The design of an average chart focuses on a specific question - how do you choose control limits?
The upper control limit is referred to as UCL whereas LCL stands for lower control limit. Normal distribution is supposed to be a suitable model in order to describe themonitored characteristic and thus the calculation of the Shewhart average chart is based on this distribution model...