Statistics forms the basis of quality control. This is the reason why you should know basic statistical principles off pat. Do you feel secure in your knowledge?
1. Pharmaceuticals are bottled and sealed. You test a total of 800 bottles for leaks and identified 6 bottles whose cap seal was broken. What is the assumed proportion of bottles in the population whose seal is broken (confidence level 1-α = 95%)?
- Between 2.757 and 16.252%
- Between 0.2757 and 1.6252%
- Between 0.02757 and 0.16252%
2. Now you check the filled volume of the bottles. This characteristic is assumed to be normally distributed. You take a sample of 36 bottles leading to a standard deviation s of 1.2 ml. Which value do you assume for sigma regarding the population (confidence level 1-α = 95%)?
- Between 0.973 ml and 1.560 ml
- Between 0.832 ml and 1.573 ml
- Between 0.796 ml and 1.482 ml
3. Based on the sample of 36 bottles, the average filled volume x amounts to 33.125 ml and the standard deviation of this filled volume is s = 1.2 ml. You still assume a normally distributed population. What might be the value range of location parameter µ?
- Between 31.88 ml and 33.670 ml
- Between 32.580 ml and 33.670 ml
- Between 32.719 ml and 33.531 ml
4. Which one of the following characteristics refers to a nominal scale?
- Name of the employee
- Age of the employee
- Size of the employee
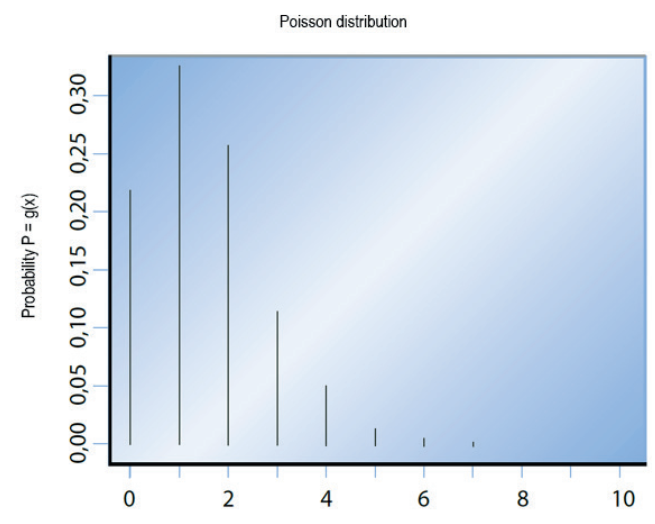
5. The following diagram shows the probability function g(x) of a Poisson distribution. Parameter µ = 1.5 depends on the number of errors x. What is the probability of having 2 to 4 errors in the next unit you produce?
Our Q-QUIZ is published once a month. You can find the answer to all questions of the current quiz online with the release of the next quiz.
This quiz was originally published in the June issue 2015 of the German magazine QZ Qualität und Zuverlässigkeit at http://www.qz-online.de/.