COMPARISON: CAPABILITY ANALYSES FOR MEASUREMENT PROCESSES ACCORDING TO VDA VOLUME 5 AND MSA
2015-11-03 - About similarities and differences
| Name | Usage | Duration |
|---|---|---|
| privacylayer | Status Agreement Cookie hint | 1 year |
| Name | Usage | Duration |
|---|---|---|
| _ga | Google Analytics | 2 years |
| _gid | Google Analytics | 1 day |
| _gat | Google Analytics | 1 minute |
| _gali | Google Analytics | 30 seconds |


11 November 2013: Stephan Conrad
Since the publication of the 4th edition of the AIAG Core Tool MSA reference manual, there is one modification that has given the participants of our seminars plenty to talk about. This manual recommends the ANOVA method for the calculation of Gage R&R results. It considers the average range method to be unsuitable which causes huge problems for users of “download-Exceltables- from-the-Internet” tools. Whereas ARM seemed so simple to interpret and was even easily comprehensible with the help of a calculator, ANOVA hides behind a whole lot of abstract, complex formulas.
However, in the meantime, almost every OEM demands the application of analyses of variances. Even larger suppliers such as Bosch completely adapt their new Bosch booklet 10 to ANOVA. This booklet actually refers to ARM as “outdated”. It seems like there is no way around it – you have to deal with this calculation method.
Well, not everybody wants to pore over formulas and work through incredibly long multiple sums. But how can we explain the approach and particularly the advantages of ANOVA? Let’s have a try. And to put all critics on the alert by now – the author does not attach any importance to mathematical precision but tries to explain these phenomena comprehensibly and wants to underline the special features of these methods. As an example, the graphics used in the following will hardly be able to illustrate that you have to add variances instead of standard deviations. This is why I want to put something straight – never perform an addition, subtraction or whatsoever type of operation with standard deviations. Not for nothing refers ANOVA to “analysis of variance”. So the calculation is always based on the squares of standard deviations that are also called variances!
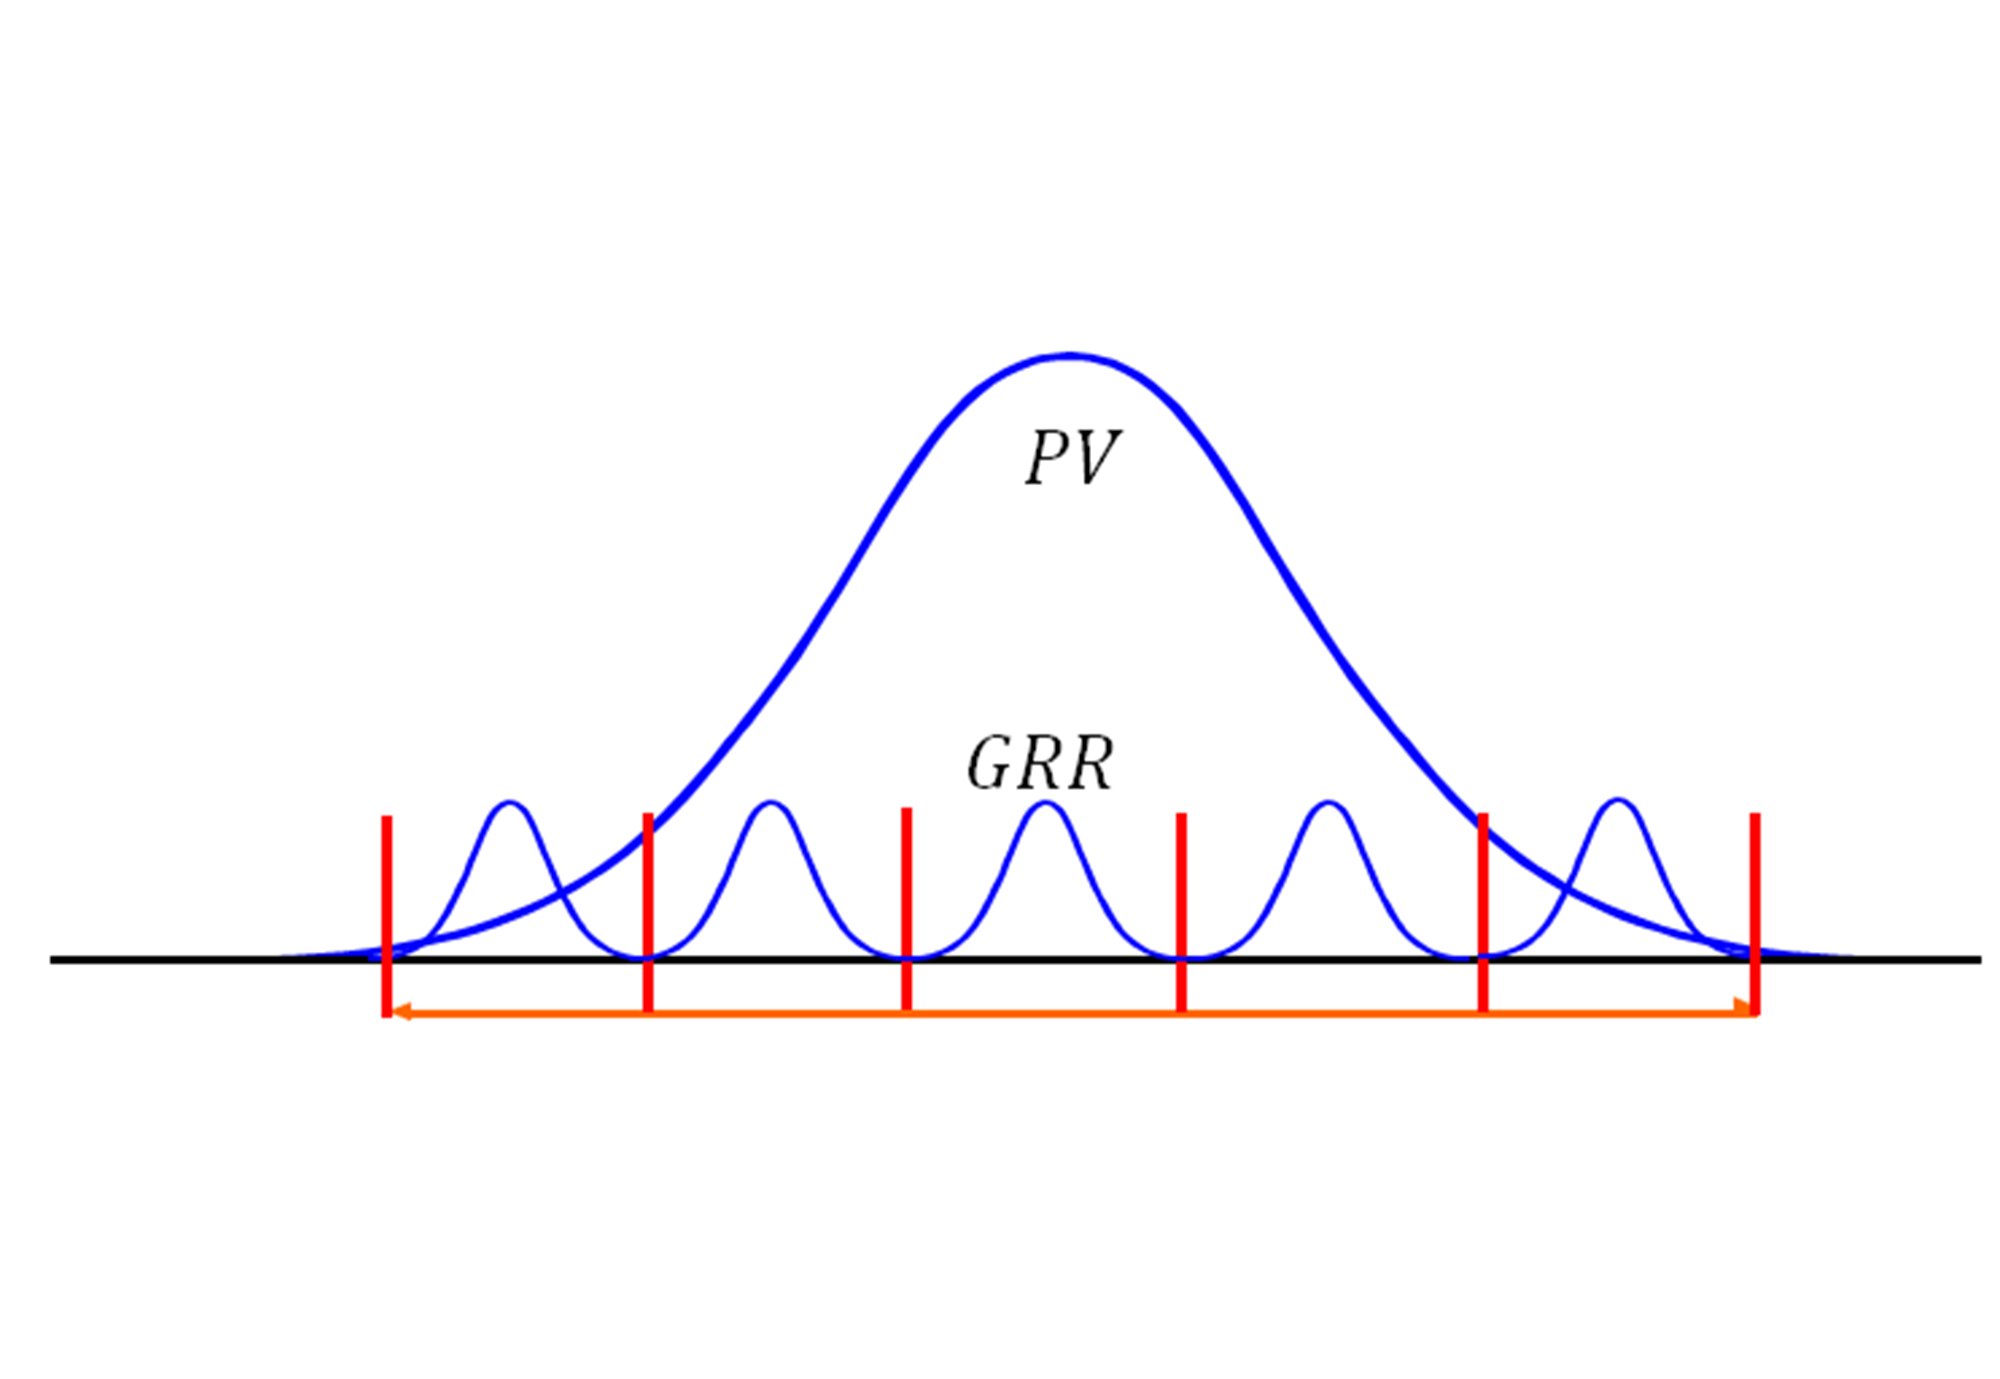
When using the average range method, you just read repeatability and reproducibility directly from a very well-arranged table of measured values.
Appraisers repeat their own measurement and calculate ranges. There are three appraisers and each appraiser measures 10 parts twice. So you obtain 10 ranges per operator. Now you calculate the average range for each appraiser trial. You obtain three average ranges, one for each appraiser. Use these three ranges to calculate the mean value of all ranges. Unfortunately, the result is a range, of course, and not a standard deviation. For this reason, you have to add correction factor K1. The calculation result specifies the repeatability or equipment variation (EV).
Now, each of these three appraisers has taken 20 measurements whose measured values should actually be equal on average. In order to find differences, you just take the averages of the three operators calculated from the respective 20 measurements and subtract the smallest average from the largest average. The result is a range one again, so you have to apply correction factor K2 leading to the reproducibility or appraiser variation (AV).
The main problem with this approach is the fact that these two variation components are calculated based on two clearly outlined phenomena. Everything that does not fit this pattern will not be considered and detected. Moreover, including correction factors in the calculation is actually a popular “source of errors” – whether you are aware of it or not.
I have got a picture in my head that illustrates the situation quite well. The average range method is like two anglers that both have their own special baits in order to catch nothing but the fish they want to have.
So this is the reason why we use the calculations according to ANOVA. From now on, I will merely focus on a “good illustration” of this approach. First, we evaluate the total variation of type-2 study. We thus take all 60 measured values, lump them together in a pot and obtain the “total variation” of this study type. MSA 4 also refers to this variation as “total variation TV”...