THE “GOLDEN RULE OF METROLOGY“ IS NO LONGER STATE OF THE ART
2015-08-04 - Find out why.
| Name | Usage | Duration |
|---|---|---|
| privacylayer | Status Agreement Cookie hint | 1 year |
| Name | Usage | Duration |
|---|---|---|
| _ga | Google Analytics | 2 years |
| _gid | Google Analytics | 1 day |
| _gat | Google Analytics | 1 minute |
| _gali | Google Analytics | 30 seconds |


06 October 2014: Stephan Sprink
Companies amass a huge amount of data as a basis for process evaluation and any associated process improvement. These data include measurement and test data, process parameter values and other types of information generated in production and in measurement and test processes. Depending on their tasks and responsibilities in a company, the respective users want to gather different kinds of information from the same data pool. These different kinds of information shall support employees in their daily work, e.g. in documenting processes and in taking specific corrective action based on this process documentation.
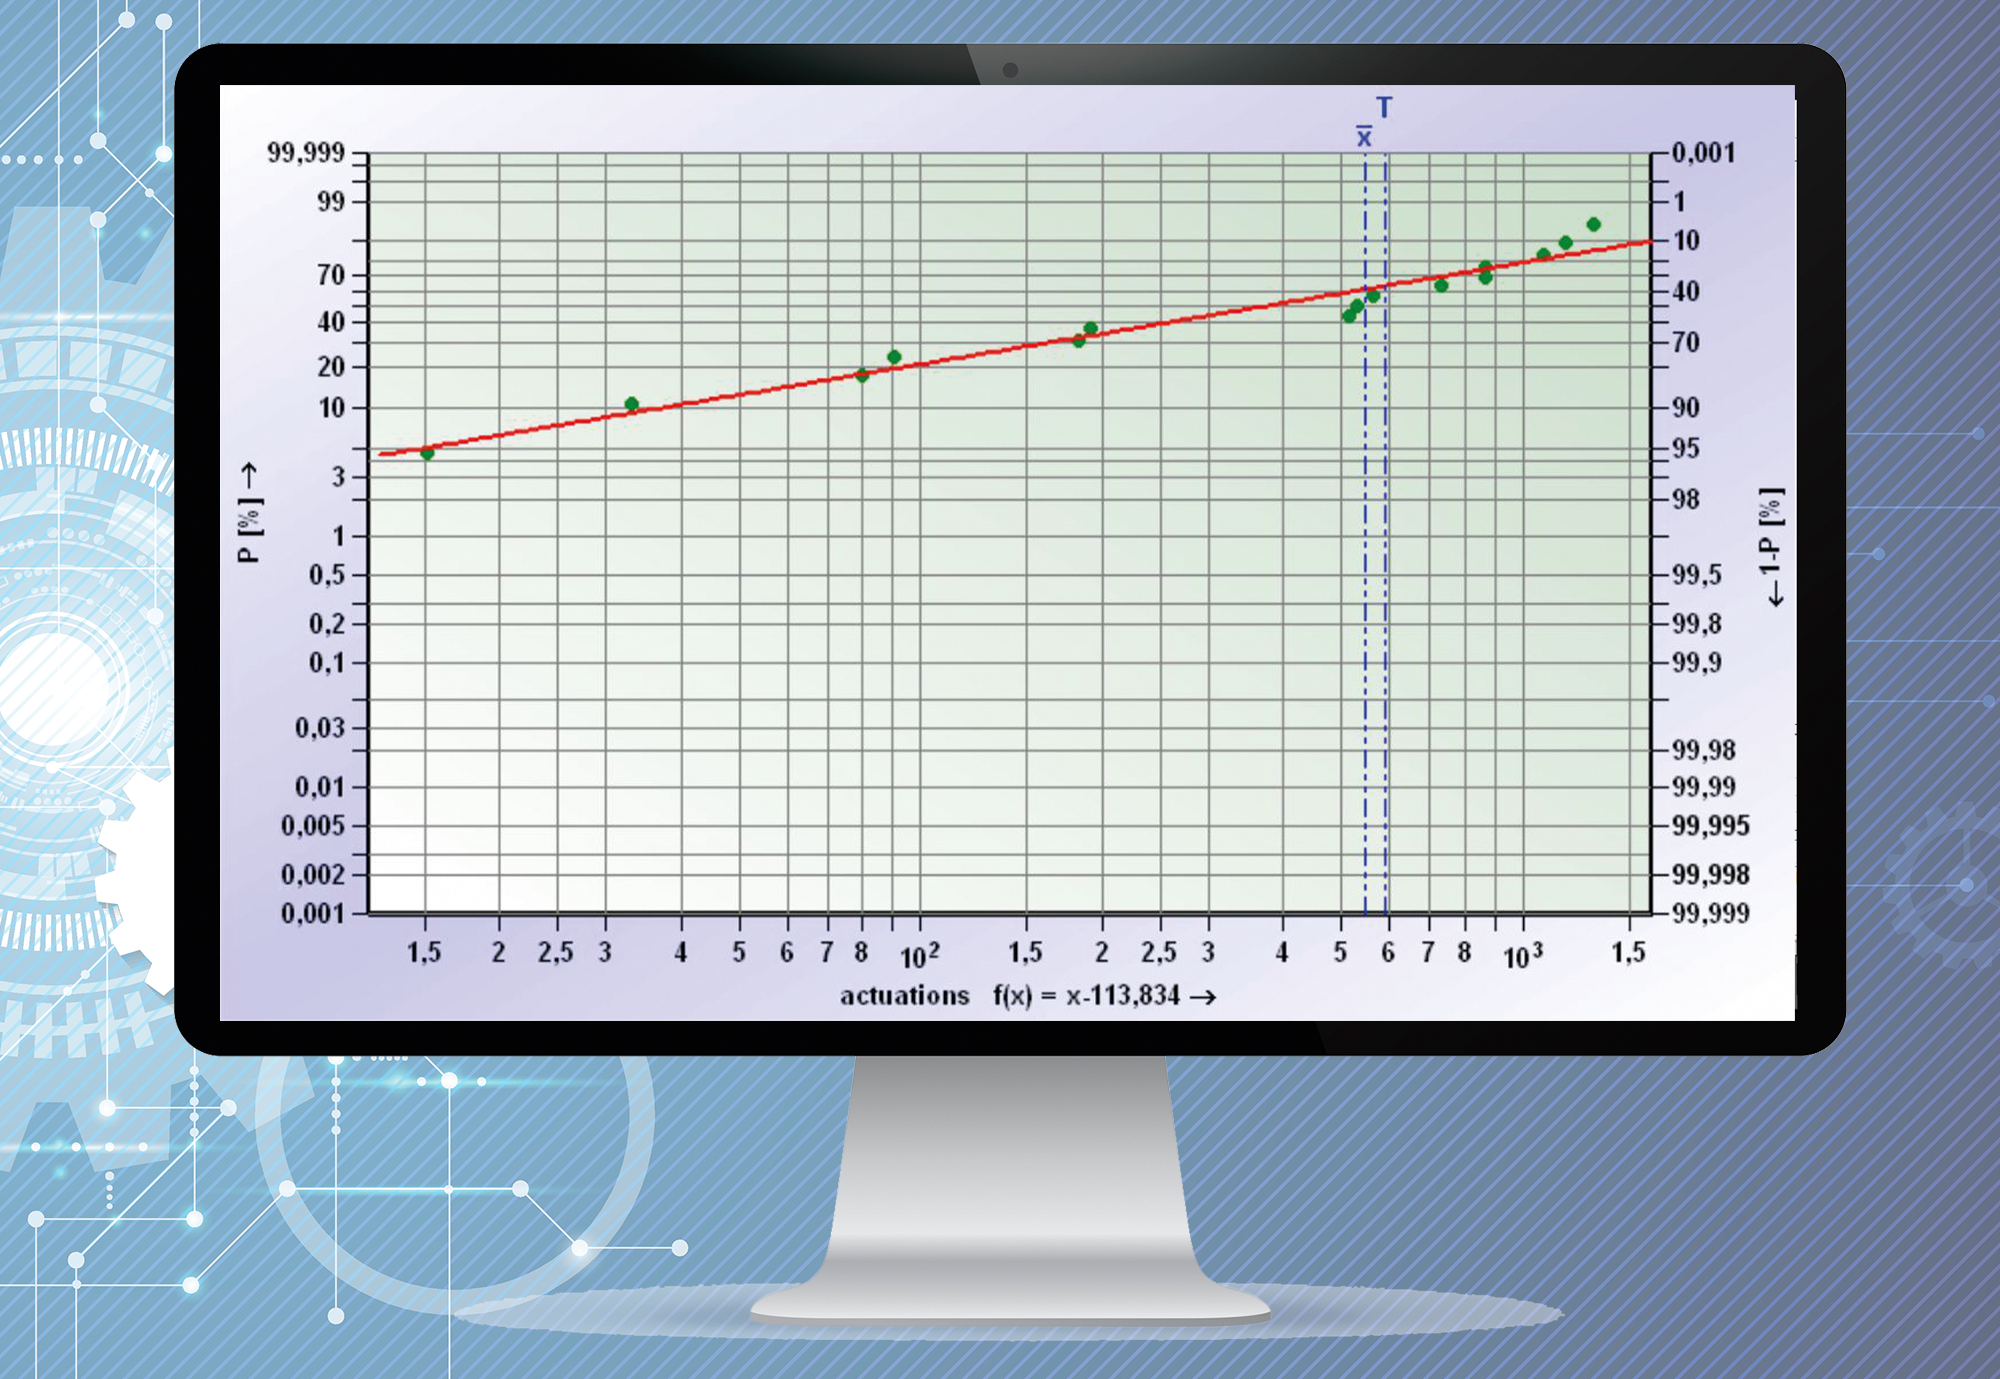
The correct calculation of desired statistics and their presentation in graphics provide the basis for each data analysis. Especially the presentation of results has to meet various requirements depending on the tasks and responsibilities of the company’s respective employee. Q-DAS software products define these crucial specifications in the evaluation strategy, a kind of pattern determining how to calculate statistics and defining process requirements (meets / conditionally meets / does not meet decision criterion). In addition to individual company-specific specifications, users may select common standards, company guidelines and standards of technical associations integrated into thesoftware. Graphics help to present the calculated statistics in a way that users are immediately able to identify any crucial process information.
You have to apply specific filter and selection criteria to any data derived from a comprehensive data pool in order to analyze these data statistically. Before defining a project, it is crucial to clearly determine any descriptive header data and additional information that shall be stored together with the measured value, process parameter value and test data. In general, the more descriptive information you store together with the actual measured value, the more flexible any subsequent data analysis based on filter and selection criteria will become...